
In the ever-evolving landscape of cybersecurity, Security Operations Center (SOC) teams play a crucial role in defending organizations against a multitude of threats. To efficiently manage and analyze incidents, having the right tools and queries at your disposal is imperative. One such tool is the powerful Kusto Query Language (KQL) used in Microsoft Sentinel. Today, I’ll be walking you through a must-have KQL query that every SOC team and client should have in their toolkit.
The Query That Delivers Insights
Let’s break down the query step by step to understand its significance:
SecurityIncident
| where TimeGenerated >= ago(24h)
| extend ProductName = tostring(parse_json(tostring(AdditionalData.alertProductNames))[0])
| summarize arg_max(TimeGenerated, *) by IncidentNumber
| extend IncidentDuration = iif(Status == "Closed", datetime_diff('minute', ClosedTime, CreatedTime), datetime_diff('minute', now(), CreatedTime))
| summarize IncidentCount = count()
    by
    IncidentNumber,
    tostring(AlertIds),
    TimeGenerated,
    Title,
    Severity,
    Status,
    IncidentDuration,
    ProviderName,
    ProductName
| extend Alerts = extract("\\[(.*?)\\]", 1, tostring(AlertIds))
| mv-expand todynamic(AlertIds) to typeof(string)
| join (
    SecurityAlert
    | summarize AlertCount = count() by AlertSeverity, SystemAlertId, AlertName, Status
    )
    on $left.AlertIds == $right.SystemAlertId
| summarize Alert_Count=sum(AlertCount), make_set(AlertName)
    by
    IncidentNumber,
    Title,
    Severity,
    Status,
    IncidentDuration,
    ProviderName,
    TimeGenerated,
    ProductName
| extend ["Alert Name"] = tostring(set_AlertName[0])
| summarize
    TotalIncidents = count(),
    FirstIncidentTime= min(TimeGenerated),
    LastIncidentTime=max(TimeGenerated),
    ClosedIncidents = countif(Status == "Closed"),
    ActiveIncidents = countif(Status == "Active"),
    NewIncidents = countif(Status == "New"),
    AvgIncidentDuration = avg(IncidentDuration),
    MaxIncidentDuration = max(IncidentDuration),
    MinIncidentDuration = min(IncidentDuration),
    SeverityDistribution = make_list(Severity)
    by ProviderName, Title, ProductName
| project
    FirstIncidentTime,
    LastIncidentTime,
    ProviderName,
    ProductName,
    Title,
    TotalIncidents,
    ClosedIncidents,
    ClosedPercentage=strcat(round(ClosedIncidents * 100.0 / TotalIncidents, 1), "%"),
    ActiveIncidents,
    ActivePercentage=strcat(round(ActiveIncidents * 100.0 / TotalIncidents, 1), "%"),
    NewIncidents,
    NewPercentage=strcat(round(NewIncidents * 100.0 / TotalIncidents, 1), "%"),
    round(AvgIncidentDuration, 2),
    MaxIncidentDuration,
    MinIncidentDuration,
    SeverityDistribution
| sort by TotalIncidents desc
Step-by-Step Explanation
1. Filtering Incidents: The query starts by filtering security incidents that occurred within the last 24 hours using TimeGenerated >= ago(24h). This ensures that your SOC team is focusing on the most recent and potentially critical incidents.
2. Extracting Product Information: The extend operator is used to extract the name of the security product associated with each incident. This is crucial for understanding which tools and technologies are generating the most alerts, enabling better resource allocation and tool optimization.
3. Identifying Key Incidents: The summarize arg_max(TimeGenerated, *) by IncidentNumber line ensures that you are working with the most up-to-date information for each incident by selecting the most recent record.
4. Calculating Incident Duration: The query calculates the duration of each incident, whether it’s closed or still active. This metric is vital for understanding how quickly incidents are resolved and for identifying any bottlenecks in your SOC’s response process.
5. Aggregating Alerts: Through the join and mv-expand operators, the query connects incident data with the corresponding alerts, giving a holistic view of the alerts tied to each incident. This is particularly useful for understanding the severity and nature of the incidents.
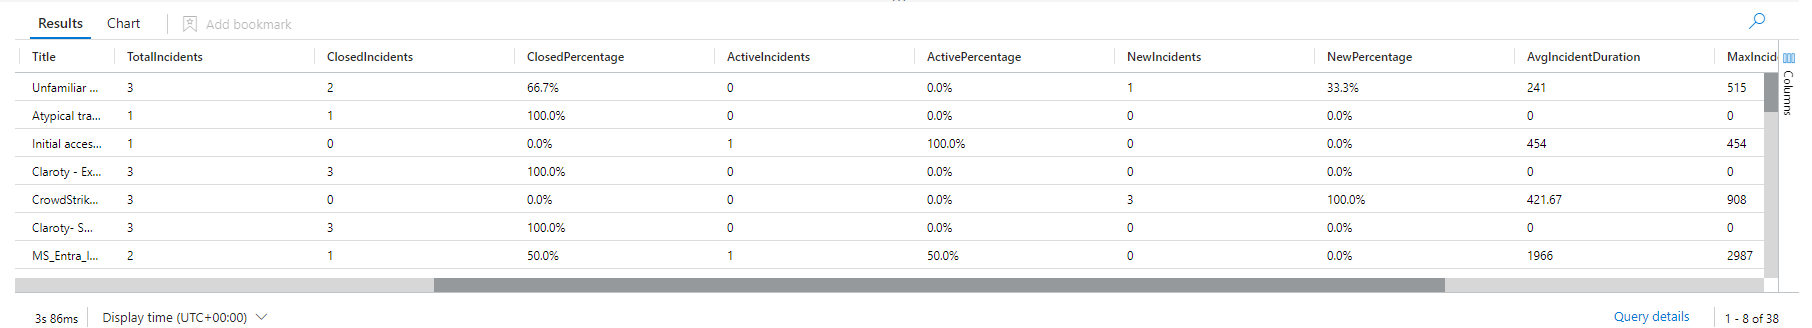
6. Comprehensive Summary: Finally, the query provides a comprehensive summary of incidents, including counts of total, closed, active, and new incidents, along with metrics on average, maximum, and minimum incident duration. It also includes a severity distribution, giving a snapshot of how severe the incidents are across your environment.
7. Clear Presentation: The final project and sort by TotalIncidents desc steps ensure that the results are presented in a clear, organized manner, highlighting the most incident-prone areas.
Why This Query is a Game-Changer
This KQL query is not just a powerful tool for analyzing incidents; it’s a cornerstone for SOC teams striving for operational excellence. By running this query, your team can:
- Prioritize Effectively: Focus on the most critical incidents and alerts, ensuring that resources are directed where they are needed most.
- Enhance Reporting: Generate detailed reports on incident trends, response times, and tool effectiveness, which can be shared with stakeholders for transparency and decision-making.
- Optimize Operations: Identify patterns in incident duration and alert severity, allowing for continuous improvement in incident response strategies.
Conclusion
In the world of cybersecurity, where every second counts, having the right KQL query at your fingertips can make all the difference. This essential query in Microsoft Sentinel not only empowers SOC teams to stay ahead of threats but also equips them with the insights needed to drive continuous improvement. Make this query a part of your regular operations and watch your SOC’s effectiveness soar.
Remember, in cybersecurity, it’s not just about reacting to threats—it’s about anticipating them. With this query, your SOC team will be better prepared than ever.

Leave a comment