
1️⃣ Introduction — The Real Problem


Most SOC teams do not struggle because they lack detections.
They struggle because they have too many poorly designed ones.
In Microsoft Sentinel, enabling analytics rules is easy.
Managing the noise that follows is not.
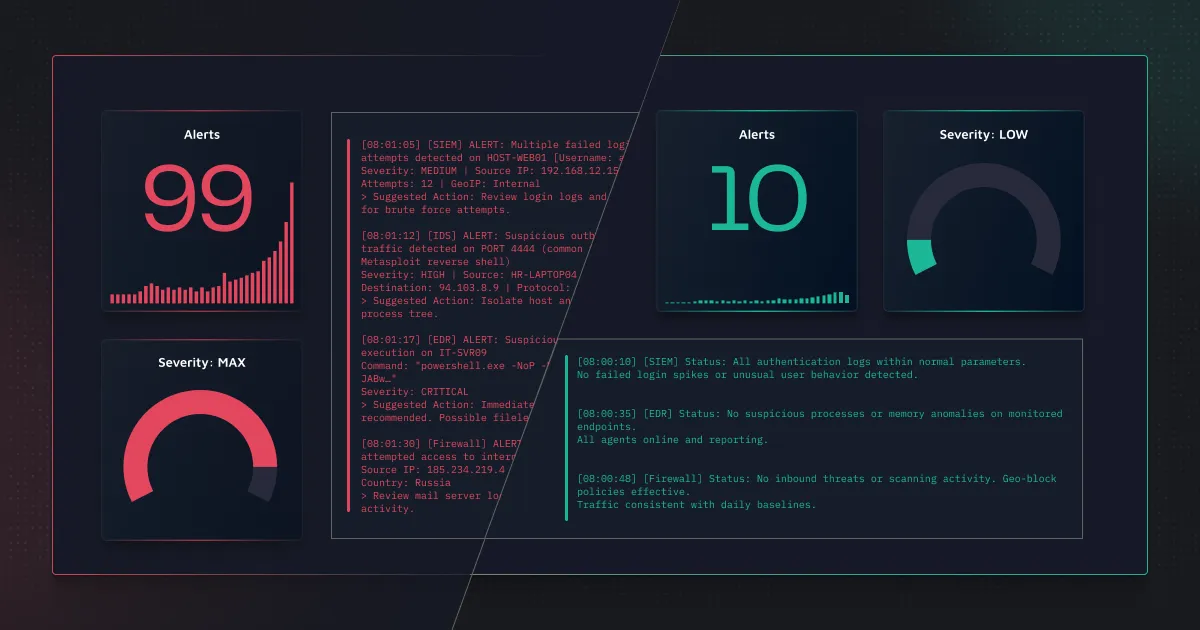
After deployment, many teams face:
- Alert overload
- High false positives
- Analysts closing alerts quickly just to keep up
- Important alerts getting ignored
The problem is not Sentinel.
The problem is how detections are selected, designed, and maintained.
Detection engineering is not about enabling more rules.
It is about enabling the right rules — for your environment.
2️⃣ Where Most SOCs Get It Wrong — And What To Do Instead
A. ❌ Enabling Rules Without Understanding the Logs
✅ Best Practice: Select Detections Based on the Logs You Actually Have


Before enabling any analytics rule, ask:
- What logs are we collecting?
- What kind of activity do these logs show?
For example:
If you only collect login logs, you can detect:
- Brute force attempts
- Suspicious sign-ins
- Privilege assignment changes
But you cannot detect:
- Malware execution
- Suspicious processes
- Lateral movement
Because those require endpoint or detailed server logs.
You cannot design strong detections without strong data.
What To Do Instead
- List the main logs available.
- Understand what activity each log type shows.
- Enable rules that match those logs.
- Avoid enabling rules that depend on data you don’t have.
Detection strength depends on log strength.
B. ❌ Enabling Too Many Rules at Once
✅ Best Practice: Deploy Detections in Phases
Some SOCs enable 100+ rules on day one.
The result:
- Alert spikes
- Analyst overload
- Quick suppression
- Loss of trust in alerts
More rules do not mean better security.
What To Do Instead
- Start with high-risk areas:
- Privileged accounts
- Domain controllers
- Critical servers
- Enable a limited set of high-confidence rules.
- Observe alert volume.
- Tune before expanding coverage.
Detection rollout should be controlled — not rushed.
C. ❌ Triggering on Single Events
✅ Best Practice: Detect Patterns, Not Isolated Activity
Weak detection:
“More than 5 failed logins → Alert”
In large environments, that is normal.
Instead, add context:
- Is the account privileged?
- Is the source IP unusual?
- Is this happening rapidly?
- Is it outside normal hours?
Single events create noise. Patterns create signal.
Good detections reflect attacker behavior — not just system activity.
D. ❌ Ignoring Risk-Based Scoping
✅ Best Practice: Apply Stronger Detection Where Risk Is Higher
Not all accounts and systems are equal.
A failed login on a normal user
is very different from
a failed login on a domain admin.
Similarly:
Activity on a test server
is not the same as
activity on a production database.
Detection sensitivity should reflect business risk.
Prioritize:
- Privileged accounts
- Critical assets
- High-impact systems
This immediately improves detection quality.
E. ❌ Alerts Without Enough Investigation Context
✅ Best Practice: Design Alerts That Help Analysts Decide Quickly
An alert should not force analysts to run multiple extra queries.
A good alert clearly shows:
- Who performed the action
- From which device or IP
- How many times
- Over what time window
- Relevant supporting details
Ask yourself:
If I were a Tier 1 analyst, could I understand this alert in under 5 minutes?
If not, the detection needs improvement.
Detection engineering must reduce investigation effort — not increase it.
F. ❌ No Review or Ownership
✅ Best Practice: Assign Ownership and Review Regularly
Detections are not “set and forget.”
Over time:
- User behavior changes
- New applications are added
- Log volume increases
- Business processes evolve
Every detection should have:
- A clear purpose
- An owner
- A review schedule (e.g., quarterly)
Track:
- False positives
- Alert frequency
- Whether the rule still adds value
A detection that is never reviewed will slowly become noise.
G. ❌ Using Suppression as the Main Fix
✅ Best Practice: Improve the Logic Before Suppressing
When alerts become noisy, the easy solution is suppression.
But suppression hides symptoms.
Before suppressing:
- Review the threshold
- Review the scope
- Check if context can be improved
- Validate the data quality
Well-designed detections rarely need heavy suppression.
H. ❌ Measuring Success by Alert Count
✅ Best Practice: Measure Detection Quality
Some SOCs say:
“We generated 5,000 alerts this month.”
That does not prove effectiveness.
Instead, measure:
- Percentage of alerts escalated
- False positive rate
- Investigation time per alert
- Repeated noisy detections
Alert volume is not success. Trusted alerts are.
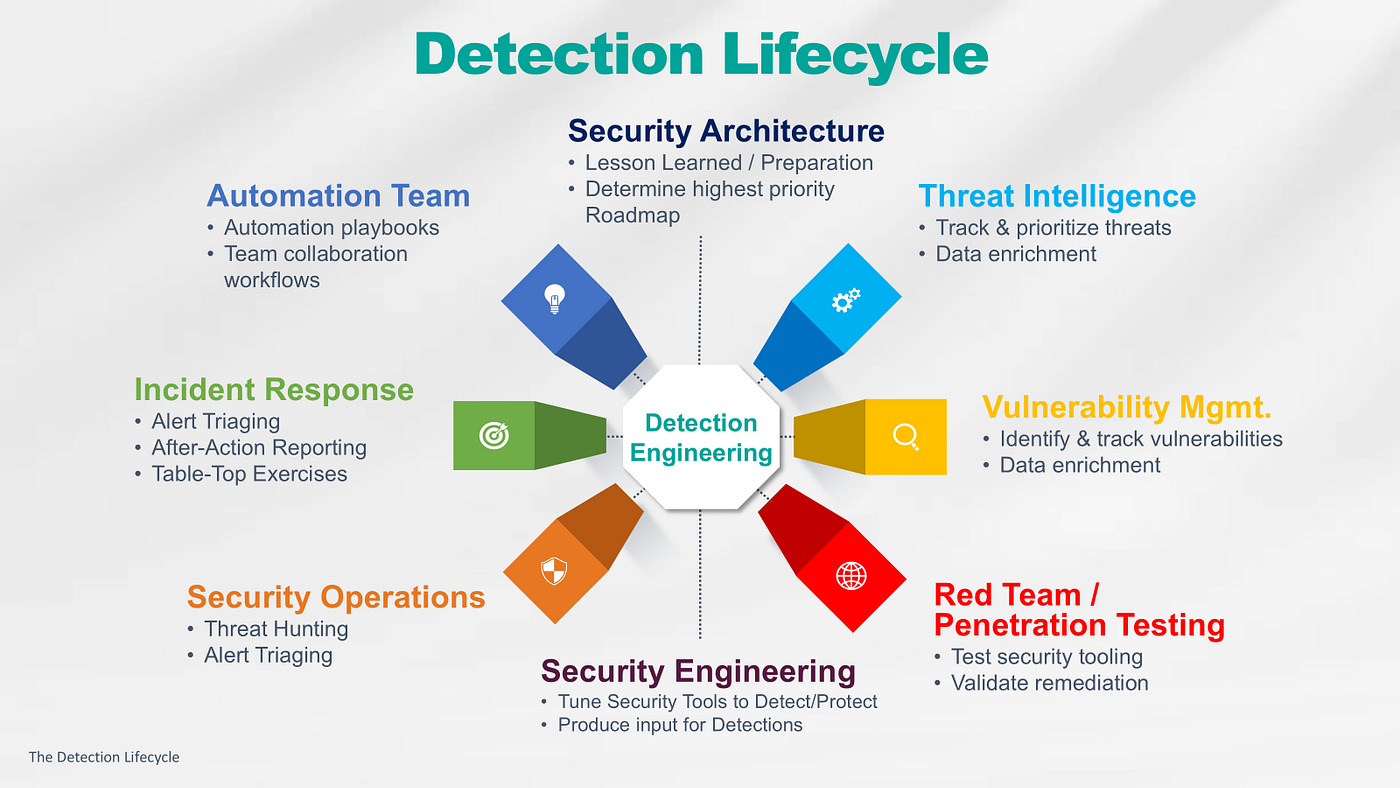
3️⃣ Aligning Detection Strategy with MITRE ATT&CK

MITRE ATT&CK is often used for reporting.
But it should be used for planning.
Many SOCs say: “We are MITRE aligned.”
But the real question is:
Can we actually detect those techniques with the logs we have?
Step 1: Map Your Logs to Realistic Attack Techniques
If you collect identity logs, you can detect:
- Brute force
- Password spraying
- Suspicious sign-ins
- Privilege escalation via role changes
If you collect endpoint logs, you can detect:
- Suspicious process execution
- Persistence techniques
- Lateral movement attempts
If you collect firewall logs, you can detect:
- Suspicious outbound connections
- Possible command and control traffic
MITRE coverage must reflect actual data capability — not just enabled rules.
Step 2: Identify Gaps Across Attack Stages
Instead of asking:
“How many techniques do we cover?”
Ask:
“Which stages of the attack lifecycle are weak?”
For example:
- Strong Initial Access detection
- Weak Lateral Movement detection
- No visibility into Command & Control
Balanced coverage is more important than large coverage.
Step 3: Use MITRE to Improve, Not Just Report
MITRE should help you:
- Identify blind spots
- Prioritize new detections
- Justify new log onboarding
- Improve coverage over time
MITRE is a planning framework — not just a dashboard metric.
4️⃣ A Practical Detection Engineering Workflow
1. Understand Your Visibility
- What logs do we have?
- What activity do they actually show?
- Where are the blind spots?
No visibility, no detection.
2. Align with Real Attack Techniques
- Map available logs to realistic MITRE ATT&CK techniques.
- Identify strong coverage areas.
- Identify weak or missing attack stages.
Coverage must reflect data reality.
3. Deploy Strategically — Not Aggressively
- Select relevant analytics rules.
- Prioritize high-risk assets and techniques.
- Roll out detections in phases.
- Avoid mass enablement.
Controlled rollout prevents alert chaos.
4. Tune Based on Operational Feedback
- Monitor alert volume.
- Track false positives.
- Adjust thresholds and scope.
- Improve logic before suppressing.
Tuning is engineering, not suppression.
5. Assign Ownership and Review Regularly
- Every detection needs an owner.
- Review performance quarterly.
- Remove redundant or low-value rules.
- Adapt as the environment evolves.
Unreviewed detections become noise.
6. Measure Detection Quality — Not Alert Count
Track:
- False positive rate
- Escalation percentage
- Analyst handling time
- MITRE coverage gaps
Alert volume is vanity. Detection quality is maturity.
Structured detection beats reactive detection.
5️⃣ Conclusion
Most SOCs do not get detection wrong because they lack tools.
They get it wrong because they rush deployment and skip structured thinking.
Microsoft Sentinel is powerful.
But the platform cannot fix poor detection strategy.
In 2026, strong SOC teams will not be defined by how many rules they enable.
They will be defined by how much their analysts trust their alerts.
Detection engineering is not about enabling more rules.
It is about enabling the right ones — and continuously improving them.

Leave a comment